Last year I wrote about making a watering chart and how I refer to areas on my acre so that I know what I’m talking about. This year, I thought I’d explain my thinking on organizing the chart according to watering zones and/or methods. From May to September, a constant eye has to be kept on watering in most places west of the Rocky Mountains. Having a semi organized way of monitoring what needs and gets water can help a lot.
I find it useful to have sections on my watering chart divided by a combination of how I water various areas and where the particular area is. For instance, I will tend to have most of the front yard watering in the same section, but I will have a list of soaker hoses that need hose attachment as a separate list from pots. So it is like zones within zones, if you want to get Venn Diagram about it.
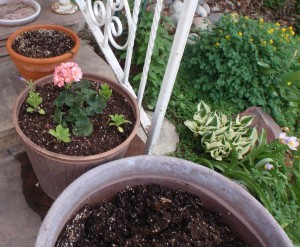
At first, I tried to list the areas more generally, but reality kept interrupting. I was so often needing to drop what I was doing and attend to children or other responsibilities, that I learned the benefit of having more specifics on my chart. Where once I would list an item as “all front yard pots,” I now list “front porch pots,” and so on, so that an item to be watered is limited to what I can reach while standing in one place without moving the hose much. Then, when I can go back to the watering, it is easier to remember and mark off exactly what has been watered.

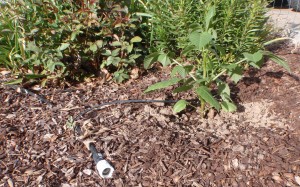
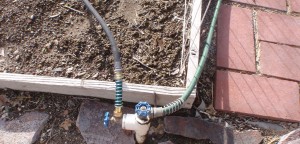
Another type of zone within a zone is whether or not the water will be left running. Soaker hoses or irrigation set-ups that are not part of the automatic sprinklers are often left dripping for 2-4 hours. A timer helps me keep coming back to them and making progress. If they are all in the same part of the list, it is more intuitive where to hook up the hose next.
Speaking of sprinklers, there are often sections not working quite right. Some places just need supplemental water under extreme weather conditions. It is good to leave a few empty spaces in the chart so that temporary areas can be penciled in until the repairs are made. I am considering making regular coverage monitoring part of my watering chart this year. With the sprinklers usually running at night, I have too often not noticed an issue until plants are stressed. If I am going to go to the work of planting things that need water, I might as well do my best to see that they are really getting it!

Color coding is on the agenda for highlighting how often certain places need to be checked or watered. Maybe orange for pots or spots that need checking daily, especially when it gets warm. Blue could be for soaker hoses that I run about twice a week. Green might work for areas that just need monitoring. That way, when I look at a certain section of the chart, it will be easy to determine if I am seeing the right number of checked off boxes, without having to read each item on the chart.
The time spent to make a chart will be made up quickly in time saved later, when I don’t have to struggle with remembering or making lists every day about watering. It can also save heart ache and cost, because plants will live and produce. They won’t be as susceptible to disease or pest damage if they are getting appropriate moisture, too.
Watering can be a relaxing and refreshing job, with the correct system. In the heat of summer, who doesn’t want to play in the water, anyway?


Leave a Reply